
JasperReports with ReportServer – The Basics
In this post we show you how to integrate reports generated with JasperReports in ReportServer. We will create a simple report accessing the demo content that we set up last time . We then show how to upload this report to ReportServer and execute it from there.
JasperReports Library is an open source reporting engine that allows you to create pixel-perfect reports that can be enriched with charts and the likes. In ReportServer speak, we call reports generated in JasperReports graphic reports as they are usually not used for further data processing steps but are exported to PDF to be, for example, printed.
A report in JasperReports is defined in an XML dialect called JRXML. The format is very well documented and you could, thus, specify your report directly just using a simple text editor. There is, however, no need for that as there are, in fact, two open source report designers out there: one called iReport Designer which is based on the NetBeans IDE (and has been around for quite a while) and a recent addition to the JasperReports family, Jaspersoft Studio, which is based on the Eclipse plattform. These tools make it relatively easy to design your report.
Once you have created your JRXML file two steps are required to fill the report with data and export it to some format. In a first step the report definition is transformed into a java executable class file (the experienced security analysist might spot some problem here; we will comment on that soon in another blog post on security). This file usually gets the file extension .jasper. This file can then be fed to the JasperReports library, which compiles the final output. With ReportServer these steps are automated. That is, you will only make ReportServer aware of the JRXML file.
So much for a quick introduction to JasperReports. Let us now have a look at how to run JasperReports in ReportServer. For this, the first step is to actually get our hands on a JasperReport. In the following we’ll describe step by step the creation of a simple report. Alternatively, you can simply download the end result and jump to Adding JasperReports to ReportServer.
Creating a Report with JasperStudio
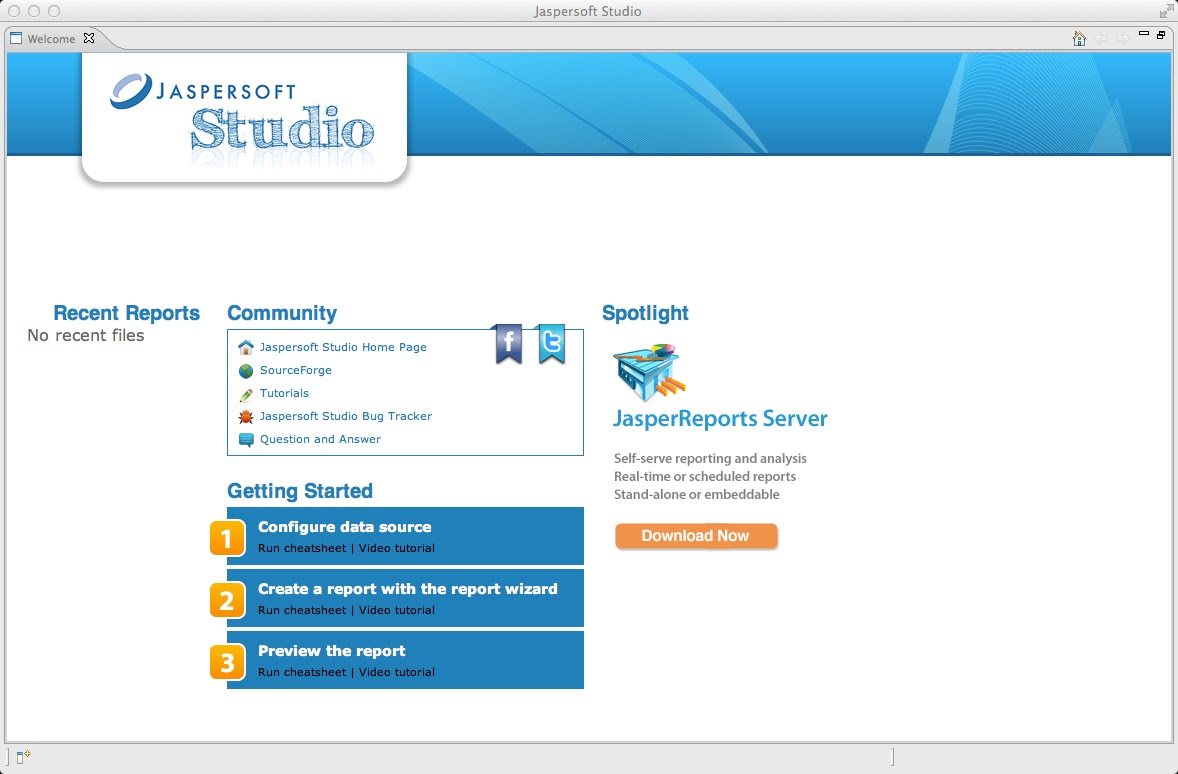
Before we begin, let me say: I am not a designer. So the report we are creating will be a good old fashioned list. First step: grab a copy of Jaspersoft Studio for your platform and install it. After starting it, you will be greeted by a welcome screen. Click on “Run cheatsheet” beneath “Configure data source” to get to the actual workspace:
First step is to add a data connection to our demo datasource. For this we assume that ReportServer is running and has loaded the demo contents into its internal h2 database, as described in our last blog post. On the left in the repository view you should see “Data Adapters”. Right click on that “Create DataAdapter” and choose “Database JDBC Connection”.

Name the datasource ReportServer Demodata, the jdbc driver is “org.h2.Driver” (note, it is not in the list, so just start typing), the connection URL is the same as we used in ReportServer, that is,
jdbc:h2:PATH-TO-INTERNAL-DB/rsdemodb
Also see our last blog for further explanation. Username and Password are “demo”.

What is left to do is to add the jdbc driver to the class path. For this click on the tab “Driver Classpath”, then “Add” and select the jar “h2-1.3.168.jar” from ReportServer’s WEB-INF/lib directory. ReportServer might at times lock the database files. To not get locking exceptions you should additionally add the connection property “FILE_LOCK” to “SERIALZED”. We can now hit “Test” and if everything was configured correctly we should get a “successful” response. Click on Finish to add the connection.
Next, we switch to the Project Explorer (the tab right next to the Repository tab), and select “new JasperReport” from the file menu. We choose the “Simple Blue Table Based” template and name the File “customer_list.jrxml”. It will be added to the “MyReports” folder which was automatically generated on startup.

After clicking on “Finish”, the design view will be opened. We can switch between the design view and the actual source view using the tabs beneath the main window. Editing the report is straigthforward in a WYSIWYG-fashion. We double click title and description to change the wording and can move elements by simply dragging them to the desired position. The template already contains a table, which we are now going to fill. For this double click into the table and the view should change to only display the table.
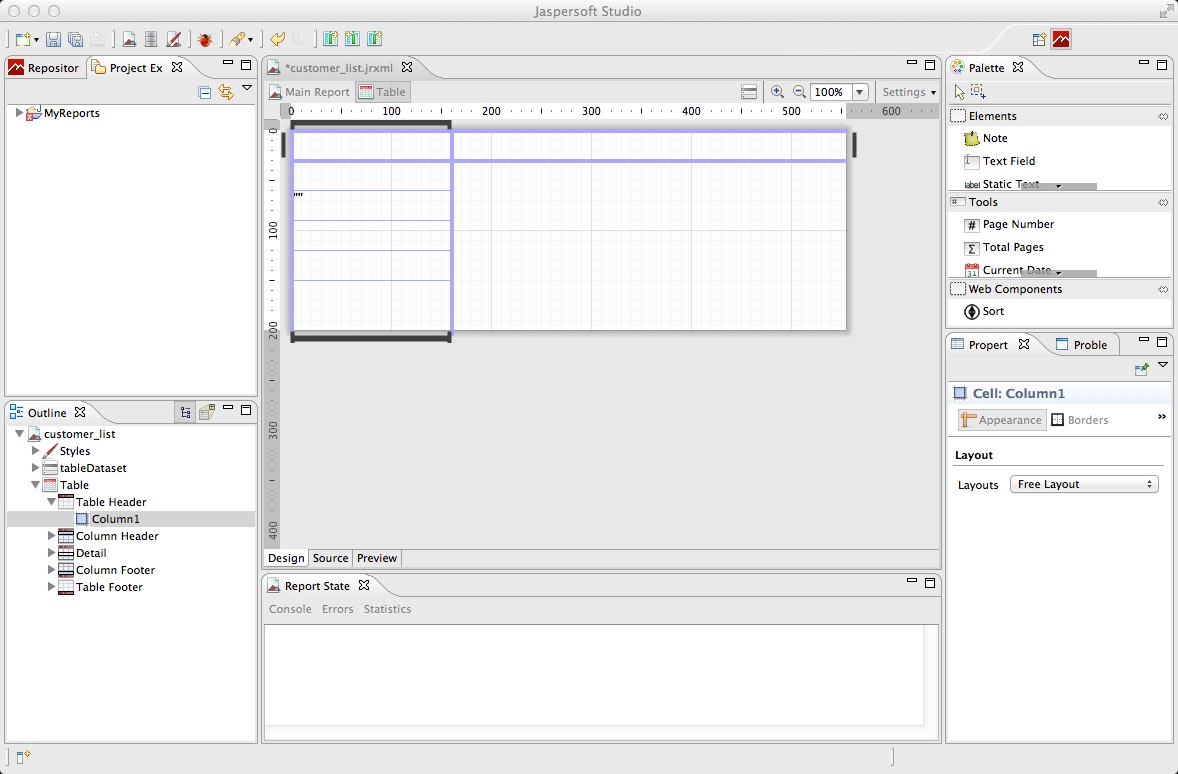
In the lower left, you see the outline of the table. It consists of a Table Header, Column Header, Detail, Column Footer and Table Footer. We are going to add three more columns. For this, open the “Detail” node, right click on Column1 and select “Create Column at End” 3 times.

As you can see, columns were not only added to the Detail part of the table, but also to the other “bands”. As we don’t want a table header, table footer nor column footer, we can simply delete the corresponding cells (careful, do not delete the columns, as they are deleted in all bands). After the cells got deleted, the corresponding nodes are only displayed in faded text.
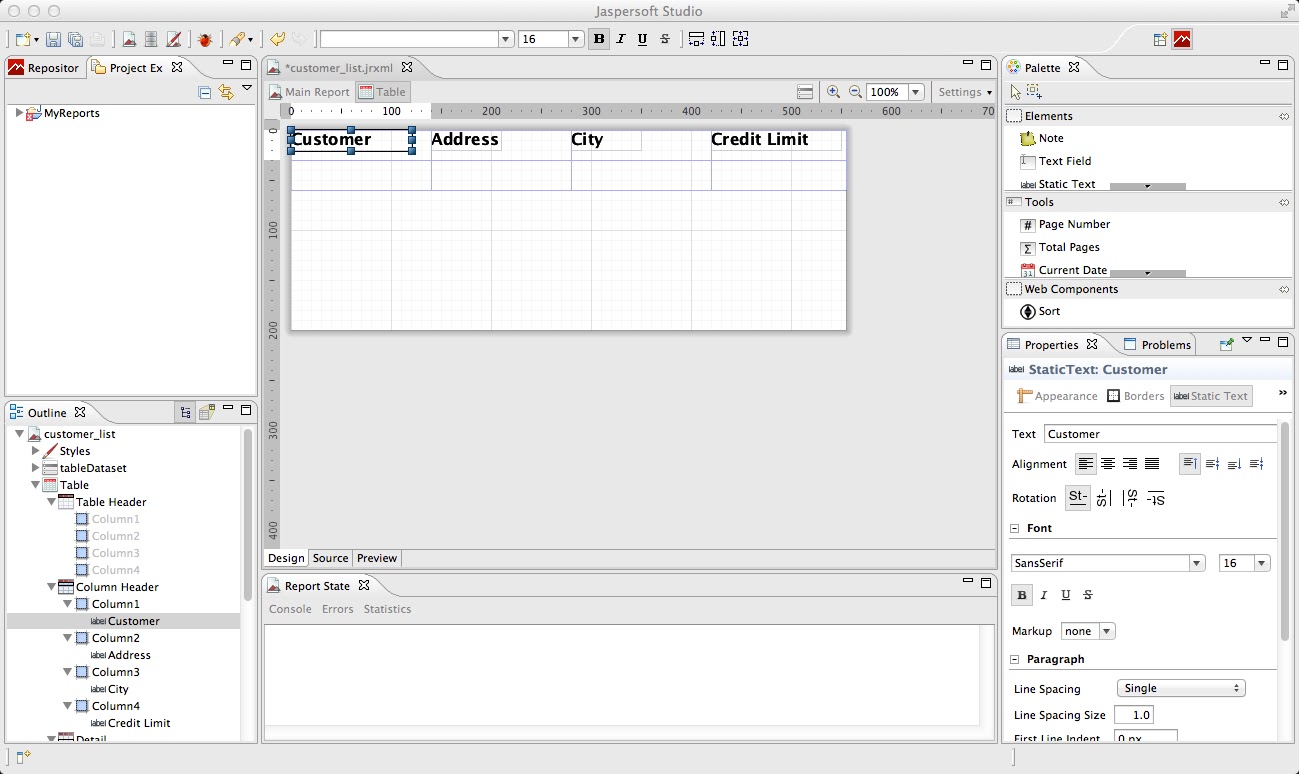
Next, we are going to spread the table across the page, making each column wider. This we can simply do by drag and drop in the design view. To add column headers, we choose static text labels from the right Palette (under Elements) and simply drag them to the top cells. We label the four columns “Customer”, “Address”, “City” and “Credit Limit”. To edit the text properties, such as size, use the properties tab on the bottom right. You should also be careful, that the static labels all fit well into the cells, as otherwise Jasper will complain on compile (if there is a conflict you should see a small yellow sign somewhere near the conflict).
Now we can add data to the detail band of the table. For this we first have to add the previously created dataset to the table’s dataset. This can be done in the outline (bottom left). Rightclick on “tableDataset” and select “Dataset and Query…”.

In the popup window select the “ReportServer Demodata” datasource in the top toolbar and write as Query:
SELECT * FROM T_AGG_CUSTOMER
Click on Read Fields to load all fields from the table.
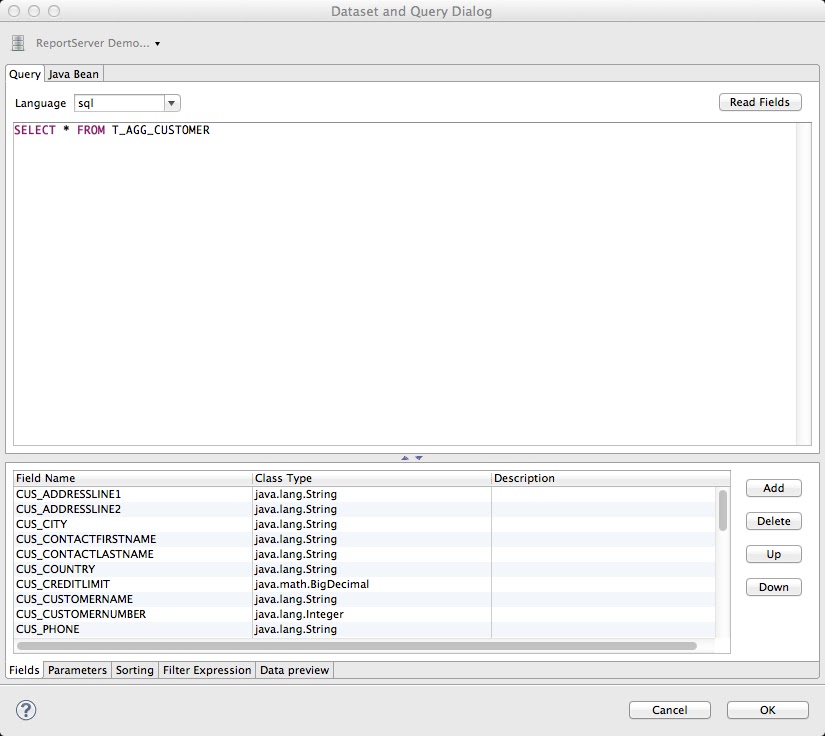
Hit OK and the fields are added to the list of Fields in the outline for the tableDataset. We can now simply drag and drop the following fields to the corresponding cells: “CUS_CUSTOMERNAME”, “CUS_ADDRESSLIN1”, “CUS_COUNTRY”, and “CUS_CREDITLIMIT”.

That is it. We can now have a look at the outcome by clicking on the preview tab beneath the main window. If the report does not contain any data, you need to select the correct datasource from the toolbar.

With this we have our JasperReport. You can also download the resulting jrxml file here.
Adding JasperReports to ReportServer
Now we can add the report to ReportServer. For this, startup ReportServer and login. Go to the administrator module and there to the report management view. Rightclick on a folder and add a new report of type JasperReport. Give the report a name, and select as datasource the demodatasource that we have created last time. Note that you do not need to add any queries, as these are part of the report’s JRXML specification. Now, all you need to do is upload the JRXML file as “JRXML Master”.

Hit Apply. We can now open the report in ReportServer, for example, by simply double clicking on the corresponding node in the tree. ReportServer presents you with a PDF Preview. To export the report into various formats, choose the desired format from the toolbar.

So much for toady. Of course, there is more to JasperReports. For example, you can add parameters or sub reports. ReportServer also offers you to add a second datasource with which you can obtain the underlying data as an unformatted Excel file. This and more will be covered in upcoming tutorials.