Appendix A. Report Documentation
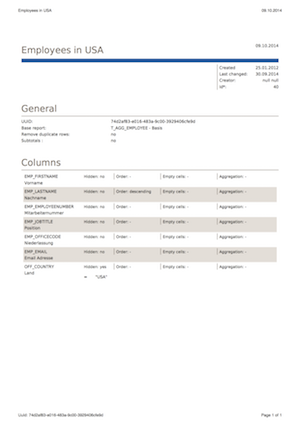
The report documentation shows general information such as the report name and the creator as well as the selected configuration. In the example you see the report documentation of a graphical report. Since the configuration in this case consists only of parameters, the documentation contains only these details. For each parameter, the selected values are listed. Please note that the values shown here correspond to the values stored in the data.
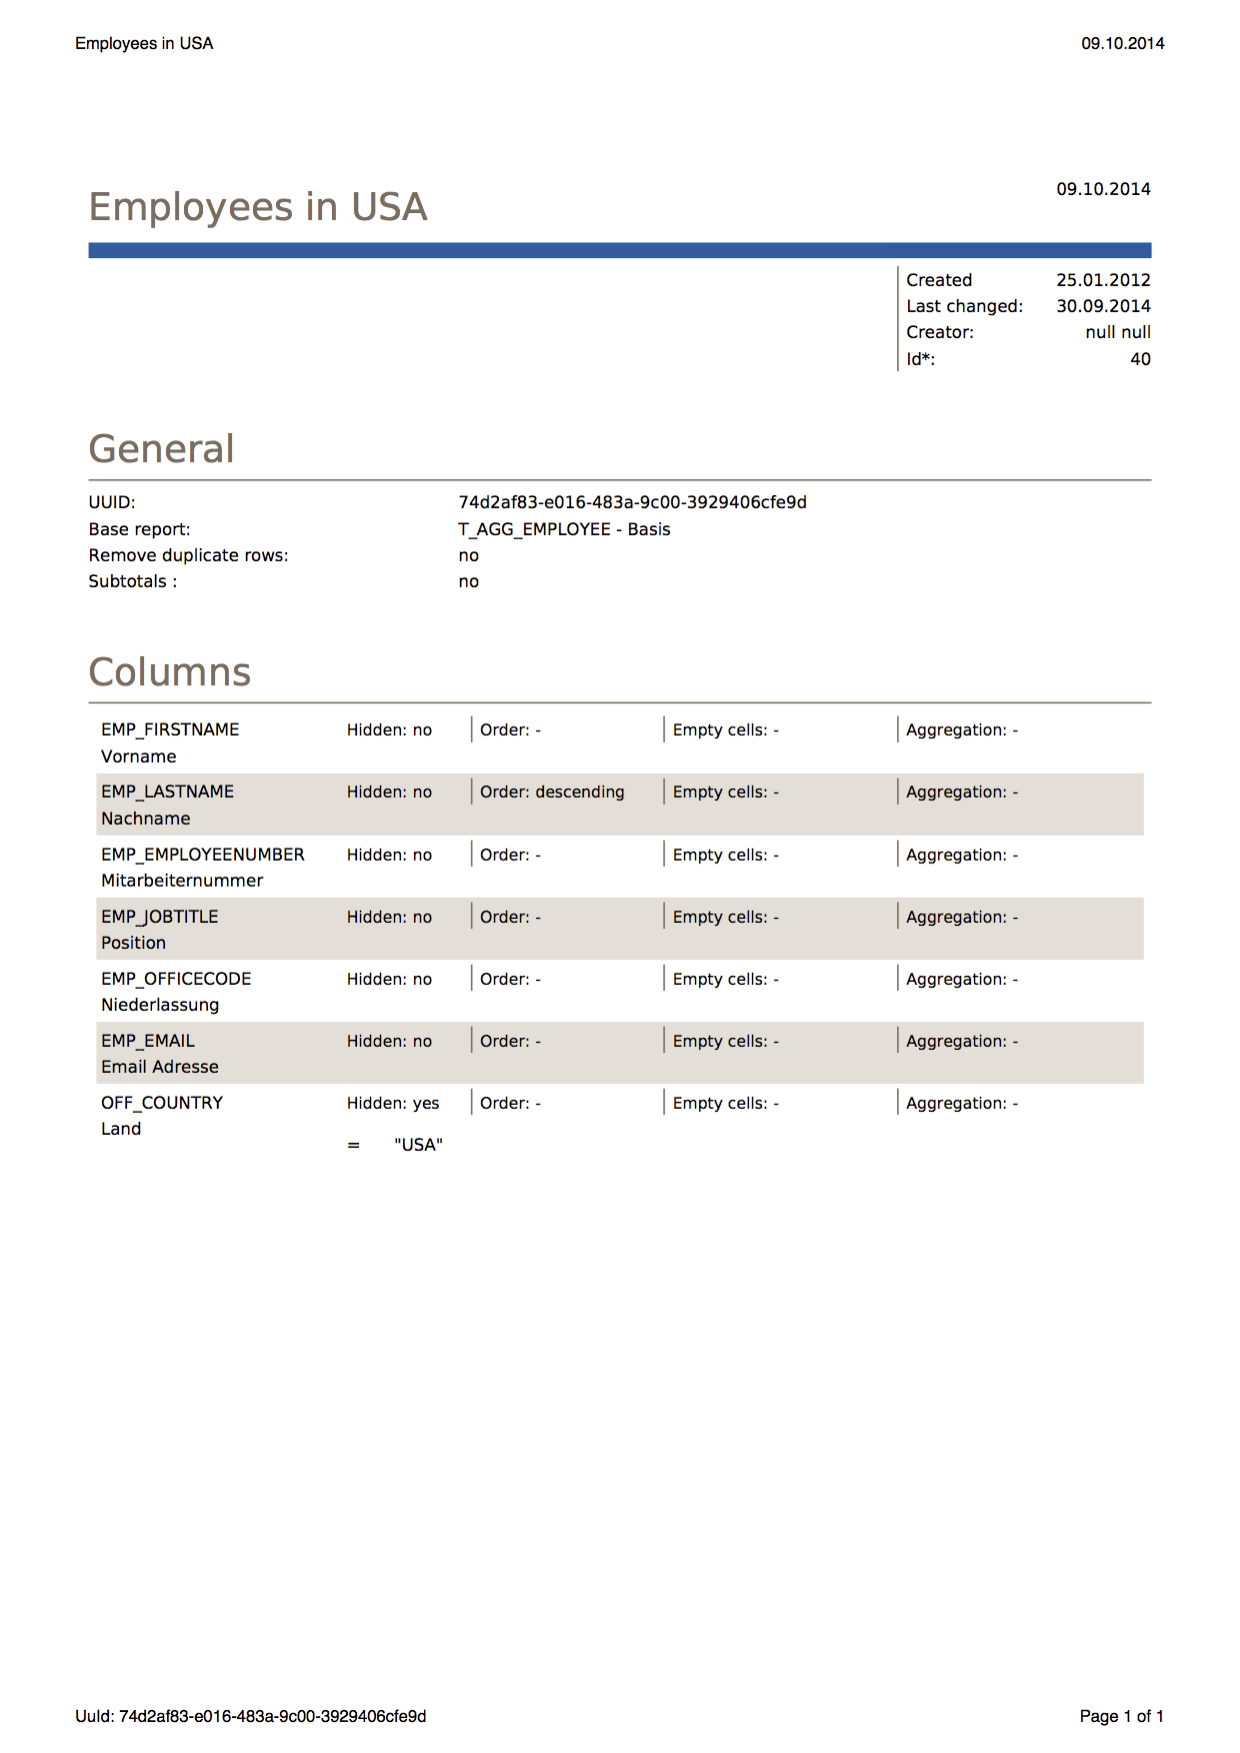
For Dynamic Lists, the report documentation displays all selected settings in detail. First, parameter settings are listed (if available). Afterwards, all computed fields are listed including their calculation expressions. Pre-filters are shown---similar to the representation in this manual---in the form of Nassi--Shneiderman diagrams. Filter conditions are specified in the following form:
	= 		Inclusion
	<> 		Exclusion
	[] 		Inclusion interval
	][ 		Exclusion interval
All selected columns are listed. In addition to information such as the column name, all selected settings (aggregation, sorting, filters, format, etc.) are shown. Filters are specified in the same way as pre-filters.
Additional information includes the list of TeamSpaces and schedules that contain the specified report.