Chapter 7. The Pivot Mode of the Dynamic List
In Chapter Dynamic Lists we discussed the individual areas of the Dynamic List in detail. In this chapter we introduce a second mode of the Dynamic List that allows you to analyze data, prepare it hierarchically or as a cross table, and create charts: the Pivot mode of the Dynamic List.
To switch a Dynamic List to Pivot mode, select from the toolbar and confirm the prompt that appears. The view is reloaded in Pivot mode and you will see that the aspect has replaced the List configuration aspect. The aspects Parameters (if available), Calculated Fields, and Prefilter remain available and have the same meaning as in the normal mode of the Dynamic List.

The Pivot function can most easily be described as an extension of aggregation. To illustrate this, we consider a simple example of a product survey. The following table describes the data set of the Dynamic List and contains records from a product survey. Each row corresponds to a rating of a product by a person. In addition to product category and product, the respondent's gender and an age grouping are stored, as well as the rating.
| Product category | Product | Gender | Age | Rating |
| Electronics | TV | m | 40+ | 5 |
| Electronics | TV | m | 40+ | 3 |
| Electronics | TV | f | 40+ | 4 |
| Electronics | TV | m | 20-40 | 5 |
| Electronics | TV | m | 20-40 | 4 |
| Electronics | TV | f | 20-40 | 3 |
| Electronics | TV | m | 20-40 | 2 |
| Electronics | Refrigerator | m | 20-40 | 2 |
| Electronics | Refrigerator | m | 20-40 | 5 |
| Electronics | Refrigerator | m | 20-40 | 5 |
| Electronics | Refrigerator | f | 20-40 | 4 |
| Electronics | Refrigerator | m | 20-40 | 3 |
| Food | Cereal | m | 20-40 | 5 |
| Food | Cereal | m | 20-40 | 3 |
| Food | Cereal | m | 40+ | 4 |
| Food | Cereal | f | 20-40 | 3 |
| Food | Chocolate | f | 20-40 | 5 |
| Food | Chocolate | f | 20-40 | 3 |
| Food | Chocolate | f | 20-40 | 5 |
| Food | Chocolate | m | 20-40 | 4 |
| Food | Chocolate | m | 20-40 | 5 |
| Food | Chocolate | f | 20-40 | 2 |
| Food | Chocolate | m | 40+ | 3 |
| Food | Chocolate | m | 40+ | 4 |
| Food | Chocolate | f | 40+ | 3 |
| Product category | Product | Rating |
| Electronics | TV | 3.71 |
| Refrigerator | 3.8 | |
| Food | Cereal | 3.75 |
| Chocolate | 3.77 |
Using aggregation, you can aggregate the data in the Dynamic List (see Section 6.8.). To do so, you first determine the grouping attributes and then the attributes to be aggregated. For example: group by product category and product, and aggregate the rating using the average function.
In contrast to simple aggregation, Pivot mode provides extensive options to create, modify, and rearrange aggregations quickly. This is a powerful tool for data analysis to develop an understanding of the data basis, and it also enables new and intuitive presentation forms.
For example, you can display the aggregation above as a cross table to additionally break down the data by the respondents' gender:
| male | female | ||
| Electronics | TV | 3.8 | 3.5 |
| Refrigerator | 3.75 | 4 | |
| Food | Cereal | 4 | 3 |
| Chocolate | 4 | 3.6 |
In addition to cross tables, the pivot table allows you to quickly change the aggregation level; for example, you can switch to the product category level with a simple mouse click.
| male | female | |
| Electronics | 3.8 | 3.7 |
| Food | 4 | 3.5 |
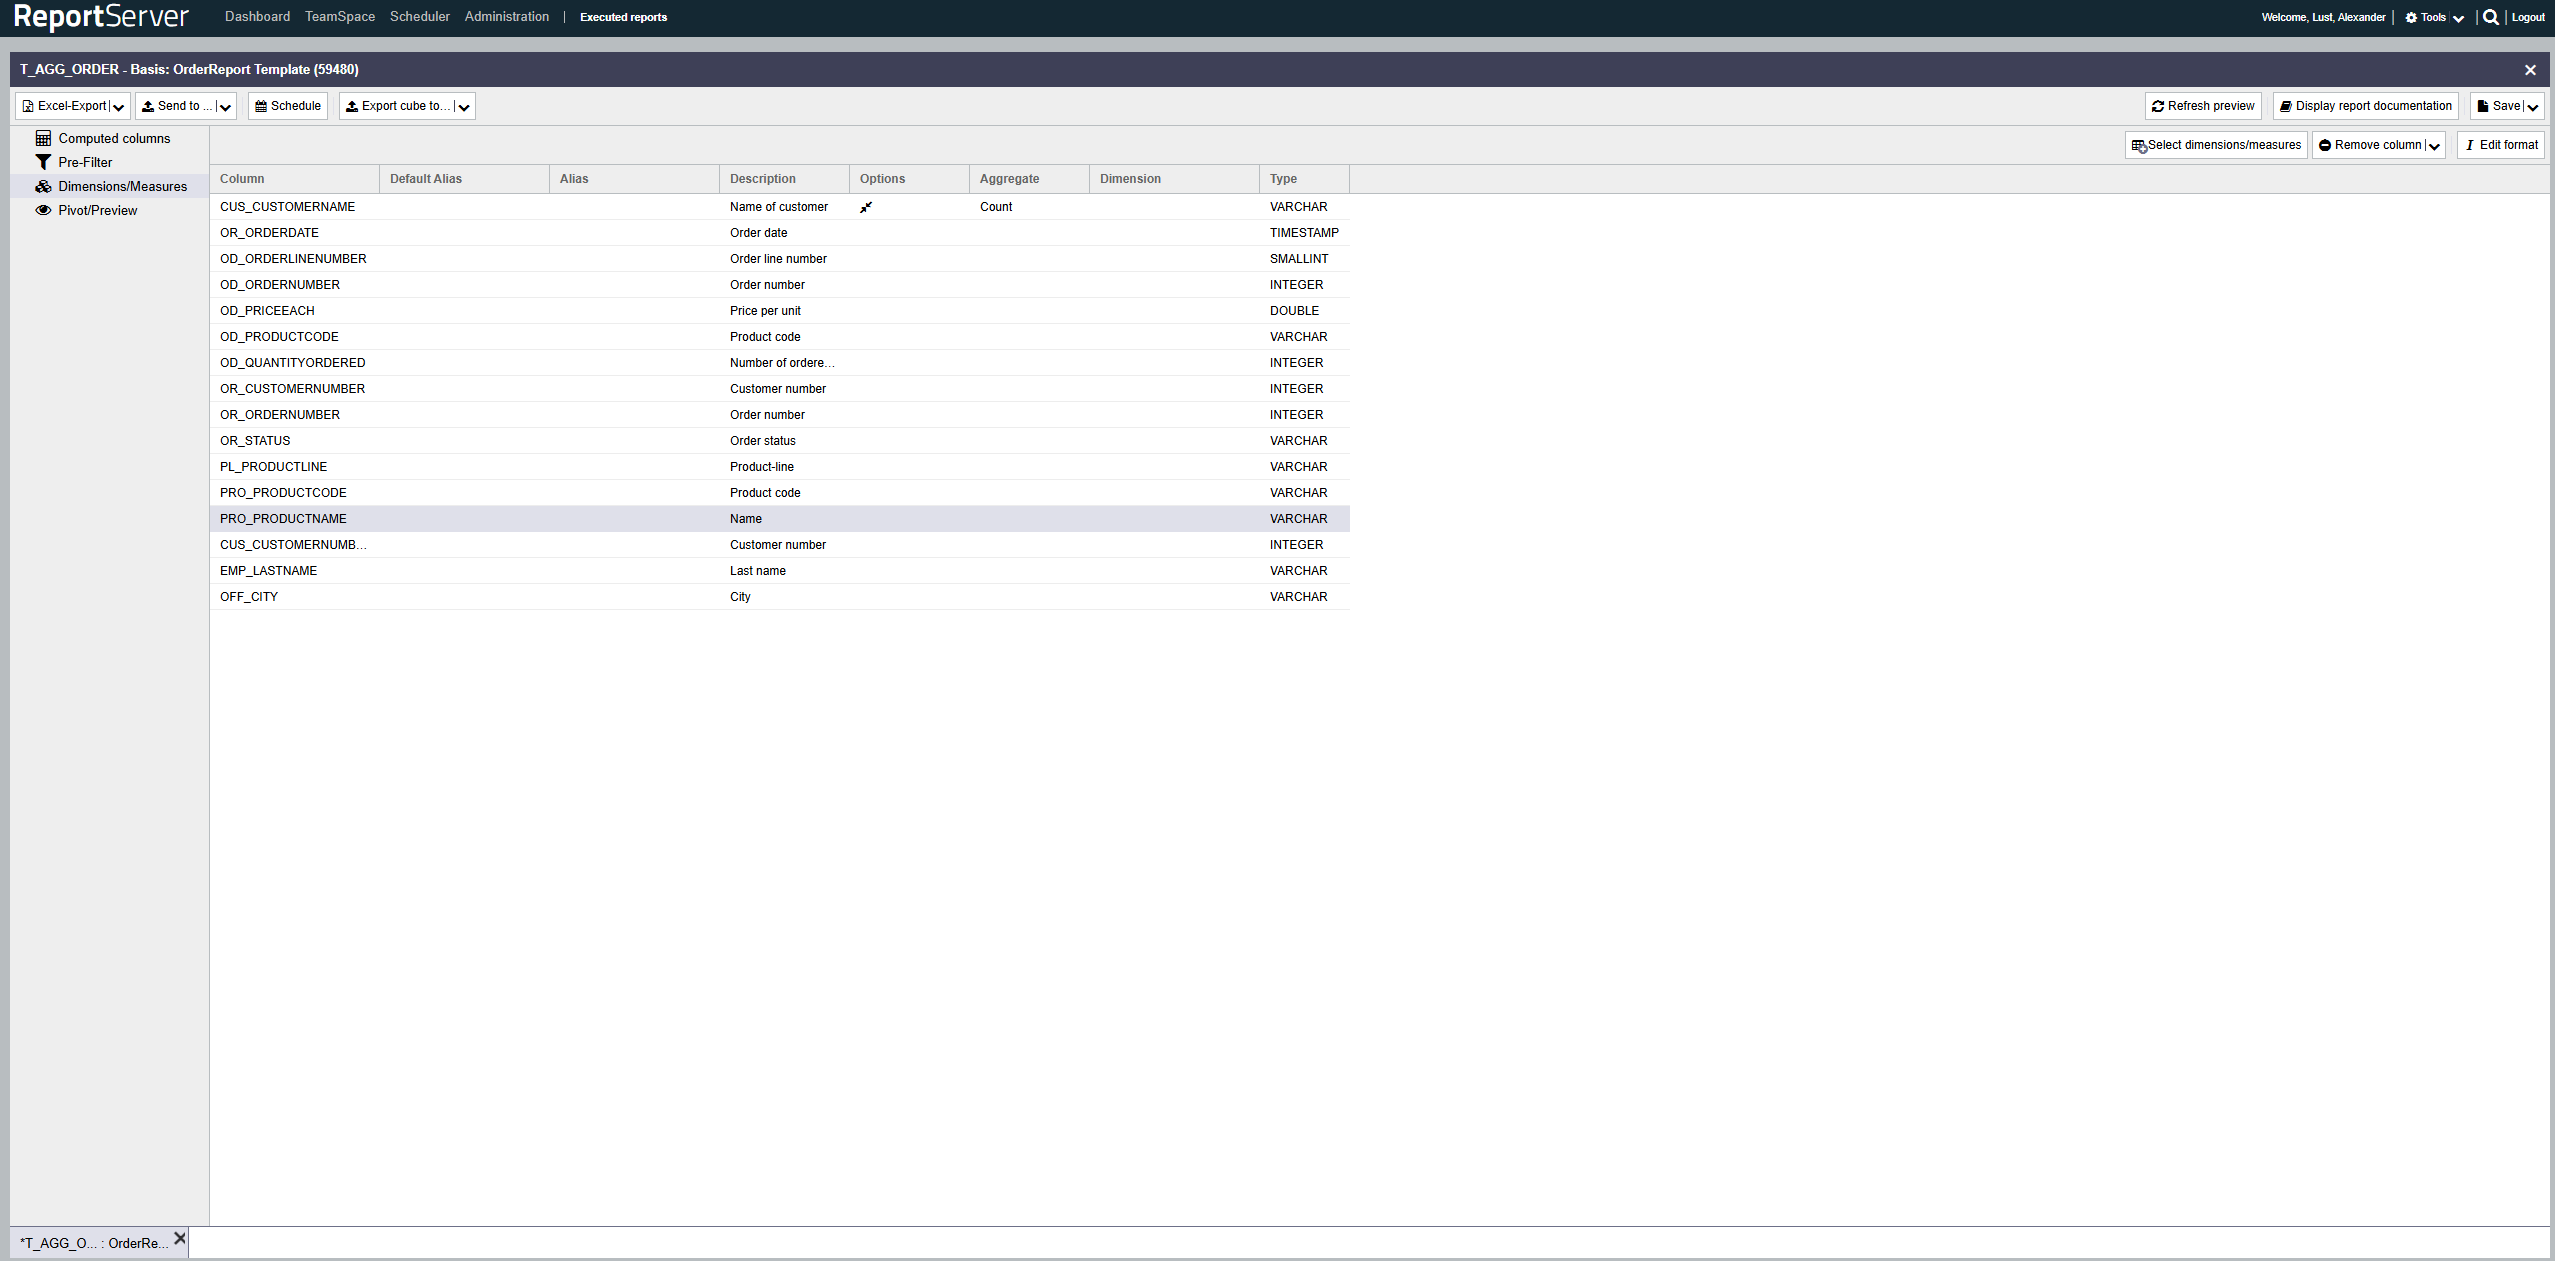
Working in Pivot mode is done in two steps. After switching the Dynamic List to Pivot mode, you first define in the aspect which attributes you want to work with and whether these attributes are grouping characteristics (dimensions) or aggregation measures. For this, you use the column selection dialog familiar from the Dynamic List. The selected columns/attributes are then displayed in a list.
By default, attributes are assigned their technical name or, if available, a predefined name. To rename attributes, click the cell (as in list configuration) and assign a new plain-text name.
To define an attribute as an aggregation measure (in the example above, this would be the Rating attribute), set an aggregation function for the attribute. The same aggregation functions are available as in the normal Dynamic List.
All attributes that are not marked as aggregation measures are treated as potential grouping attributes. A special characteristic is that grouping attributes can be organized along a shared dimension. In the example above, this applies to product category and product. Other examples are geographic attributes (e.g. continent, country, city) or time attributes (year, month, day). To mark related attributes, assign the same plain-text name in the column---in the example, for instance, Product for the attributes product category and product. In such a case, the order of the attributes matters and should be sorted from coarse to fine; in the example, product category should be above product.
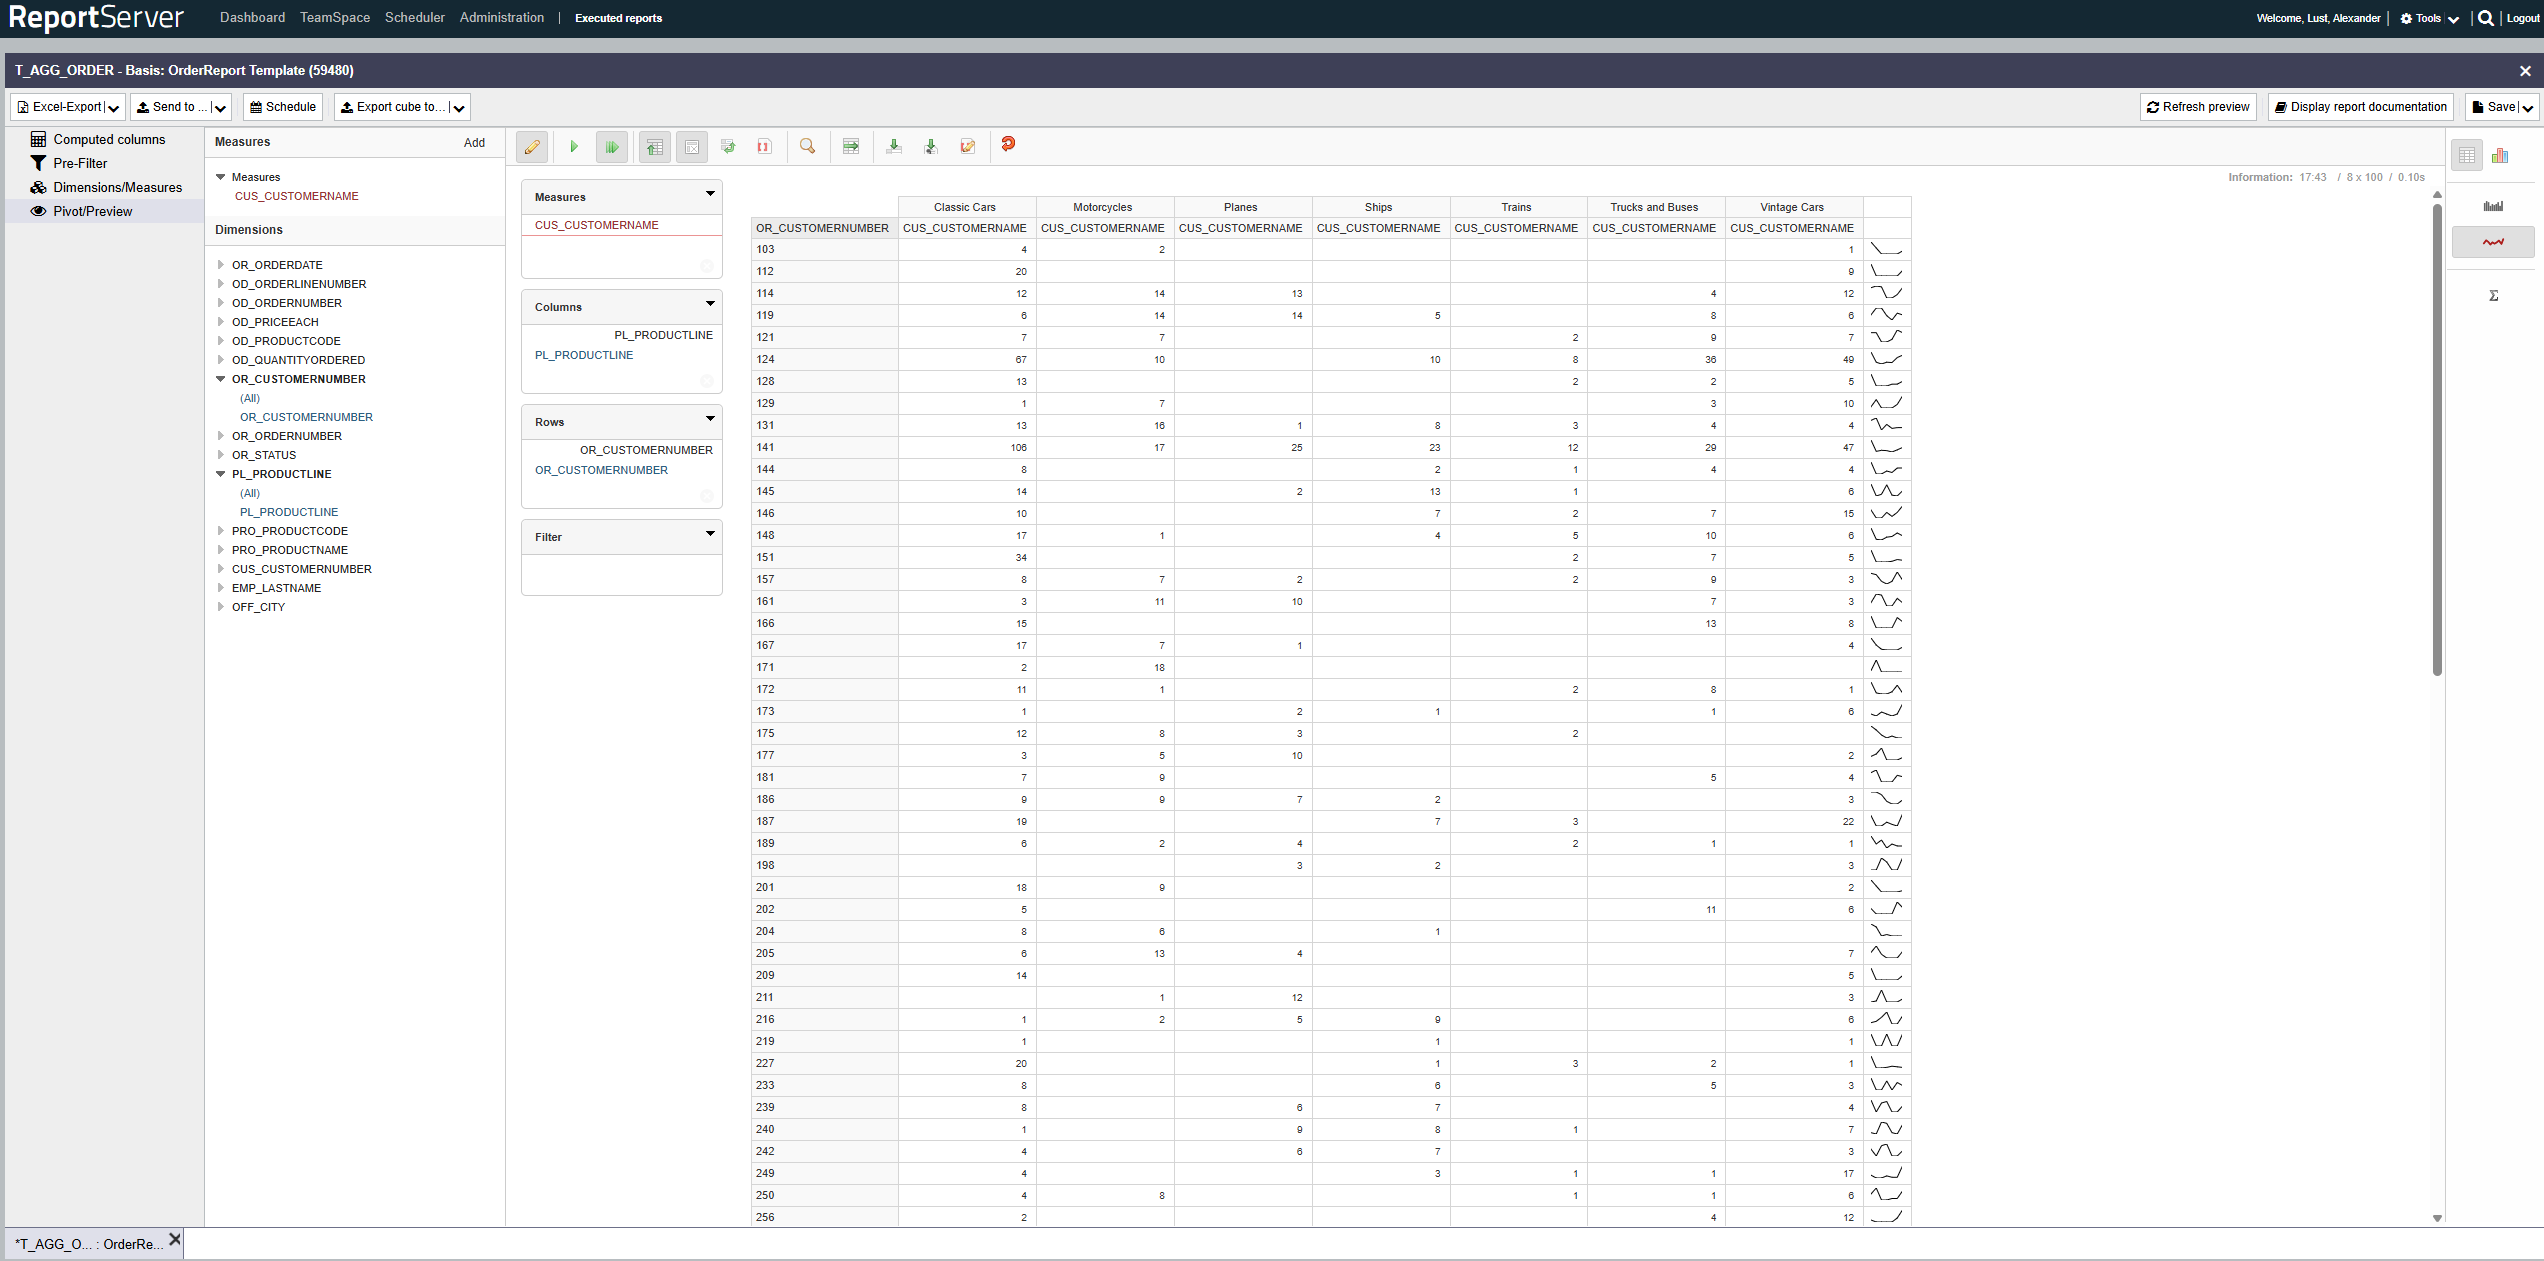
Once dimensions and aggregation measures are configured, you can switch to the aspect, where the additional configuration takes place. Note that the and aspects work identically to the Dynamic List. Prefilters restrict the overall data set. Calculated fields can serve as dimensions or aggregation measures.
We introduce the actual pivot view in the following Chapter The Analysis View (Chapter 8.). The analysis view is shared by the Pivot mode of the Dynamic List and OLAP reports (see Chapter 4.).